

2020 California Wildfires
Journalistic Data Visualization
Medium
National Geographic Magazine
Description
This project is divided into TWO parts: Journalistic Data Visualization and Artistic/Experiential Data Visualization.
Part I: Displaying static data in the infographic way on National Geographic Magazine.
Part II: Making infographic piece visually appealing by adding visual elements and graphic animations.
Date
March 2021
Tools
Illustrator, Photoshop, After Effect, Indesign
Research
About CA Wildfires
The 2020 California wildfire season, part of the 2020 Western United States wildfire season, was a record-setting year of wildfires in California. By the end of the year, 9,639 fires had burned 4,397,809 acres (1,779,730 ha), more than 4% of the state's roughly 100 million acres of land, making 2020 the largest wildfire season recorded in California's modern history.


Cause
-
Human Activity
-
Vehicle
-
Equipment use
-
Campire
-
Arson
-
Playing with fire
-
Smoking
-
Electrical power
-
Natural
-
Lighting
-
Undetermined


Science of Fire
-
HEAT:
Allows fire to spread by evaporating moisture in fuels, allowing it to ignite and travel more easily.
-
OXYGEN
16% is required. Oxygen supports the oxidation process, creating heat and gases.
-
FUEL
Gives the fire a burnable material, allowing the fire to advance.


Incident Archive


Typography
Ballinger Bold
ABCDEFGHIJKLMNOPQRSTUVWXYZ
abcdefghijklmnopqrstuvwxyz
1234567890
Myriad Pro Regular
ABCDEFGHIJKLMNOPQRSTUVWXYZ
abcdefghijklmnopqrstuvwxyz
1234567890
Display Medium

Visual Explorations
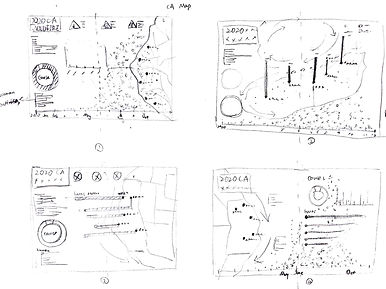
Sketches


Sketches - Digital Developments


Icons

Color Palettes
R: 109 G: 144 B: 180
HEX: 6D90B4
R: 235 G: 181 B: 131
HEX: EBB585
R: 213 G: 102 B: 43
HEX: D5662B
R: 178 G: 204 B: 182
HEX: B2CCB6
R: 206 G: 230 B: 238
HEX: CEE6EE
R: 223 G: 129 B: 55
HEX: DF8137
R: 242 G: 211 B: 180
HEX: F2D3B4
R: 184 G: 84 B: 44
HEX: B8542C
Left Page
There is a short description along side the main title. Underneath is a graph that showcase the wildfires over past 10 years. X-axial represents each month, and Y-axial represents year from 2011-2020. The height of each single triangle means the burned acres and the color correspond to the duration of its burned. On the Botton section, there are causes and science of fire.
Right Page
Half of the right page display the overall wildfire on the CA map. They are the most destructive fires in 2020. I also add the knowledge about how winds help spreading the fires.


Mission:
Showcasing the amount of wildfires in each month by using an artistic approach. And also, increasing the knowledge of its consequences. Displaying statistic data in an artistic and animated way to engage audience.
This artistic data visualization will display at the National Geography Magazine online website, it is an interactive webpage that involves user click, news recording, dynamic data display.
Elements: teris, blocks
Interactive: Each individual block represents 500 acres burned, according to the real data, they can be assembled into different shapes
Platform: National Geographic website
Audience: general public
Research
News Source
The August Complex was a massive wildfire that burned in the Coast Range of Northern California, in Glenn, Lake, Mendocino, Tehama, Trinity, and Shasta Counties. The complex originated as 38 separate fires started by lightning strikes on August 16–17, 2020.
Duration: 78 Days.
Total: 1,032,648 Acres Burned.


Medium: National Geographic Website
Visual Components


Inspiration: Tetris
Each individual box represents 500 acres burned
Different combination of boxes


Storyboard


Color Palettes
Typography
Ballinger Bold
ABCDEFGHIJKLMNOPQRSTUVWXYZ
abcdefghijklmnopqrstuvwxyz
1234567890
R: 192 G: 54 B: 69
HEX: C03631
R: 131 G: 186 B: 85
HEX: 83BA55
R: 22 G: 65 B: 180
HEX: 164194
R: 229 G: 150 B: 66
HEX: E59642
R: 238 G: 207 B: 76
HEX: EECF4C

